Debugging Server-Side Javascript
See also: Javscript Scripting Menu, Javascript Developer’s Guide, Javascript Editor, API Javadoc
All server-side Javascript scripts can be debugged regardless of how a script is invoked. This makes it possible to debug forms, SOAP and REST Web Services, system services, scheduled tasks1, workflow processes1 etc. In most cases you will be debugging something running in your local development environment, but it is also possible to debug a script running on a remote server, subject to the configured server security.
Note 1: Scheduled tasks and
workflow processes cannot currently be debugged when the target server is a
Verj.io Service Plan
Starting the Debugger
The first step is to start a debug session on the server. The server is selected using the test server dropdown in the top right-hand corner of the Studio window – usually that points to the Embedded Server and you won’t need to change it. The Studio has full access to the Embedded Server but other servers require configuration of a user with the appropriate role – see Configuring Test Servers. When changing the selected server, you may get a message informing you that the server and the studio are using different workspaces. If you’re connecting to a remote server to debug something, this message can be ignored, but you should ensure that the copies of the scripts being debugged are identical on both the studio and the server and that each script has the same relative path within the workspace.
Start a debug session by clicking on the blue debug icon ![]() on either the main toolbar at the top of the
Studio window or on the toolbar of the Debug View.
The icon changes to indicate that the debug session has been started
successfully on the server
on either the main toolbar at the top of the
Studio window or on the toolbar of the Debug View.
The icon changes to indicate that the debug session has been started
successfully on the server ![]() .
.
The debug session will remain running until you stop it by clicking on the debug icon again or by closing the studio.
Setting Breakpoints
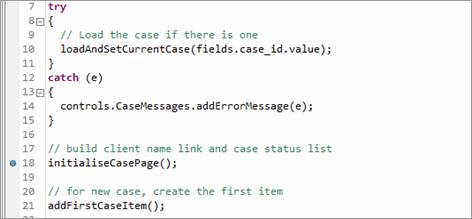
Breakpoints are added and removed by clicking in the gutter to the left of a script statement in the Javascript editor. A blue dot shows that a breakpoint has been set. Breakpoints are saved when the Studio is shutdown.
Please bear in mind that when a breakpoint is set, this applies to all users on the target server, not just the developer. For this reason you should be very careful when debugging a production system.
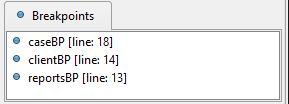
Breakpoints can also be displayed and removed using the Breakpoints Panel in the Debug View. Right click on a breakpoint to remove it.
Using the Debugger
After setting your breakpoint(s), run the application that you’re debugging normally. When a breakpoint is reached, the application will stop and the current state is displayed in the Debug View. The script will be shown in the script editor and the current line is highlighted. As you step through the script or drill down into functions the script editor will move to show the current line.
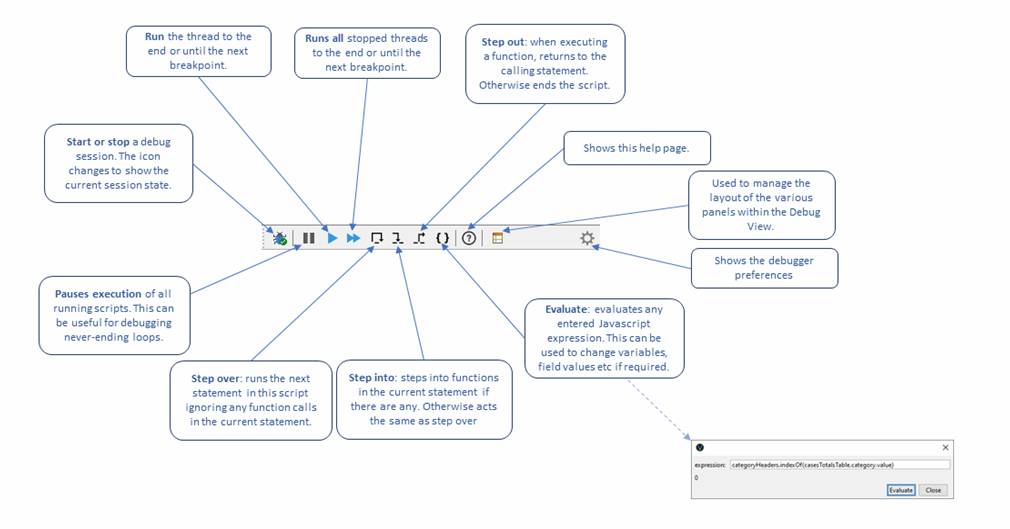
Toolbar
Stack Frame Panel
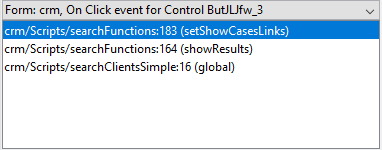
This panel is normally located on the left-hand side of the Debug View Frame. At the top of the panel you will see a dropdown list of all threads that are currently stopped at breakpoints. When multiple threads are stopped, you can select an individual thread from this list and the other debug panels will then change to show the state of the selected thread and the toolbar icons will act on the selected thread. The description text in the dropdown shows the entity type and name (Form: crm in the example below) and the event description (On Click event for Control ButLJfw_3).
Underneath the dropdown list you will see the call stack of the currently selected thread with the current breakpoint line shown at the top. Each line shows the script name and line number with the corresponding Javascript scope shown in brackets at the end of each line. Possible scopes are:
- global – this is the top level scope
- Function name – shown when executing a named function
- anonymous – shown when executing an anonymous function
So in the example below, the on click event of button ButLJfw_3 is being executed – initially script searchClientsSimple is executed which at line 16 calls function showResults in script searchFunctions, which in turn at line 164 calls function setShowCaseLinks which is also in script searchFunctions. The thread is currently stopped in function setShowCaseLinks in script searchFunctions at line 183.
Variables Panel
This panel shows all the variables that are currently within scope. At the top level, you will see the Verj.io API objects plus any local variables. Any Javascript objects or arrays or Java objects are shown with a + sign to the left and can be opened to examine the details. Also see Large Text Values.
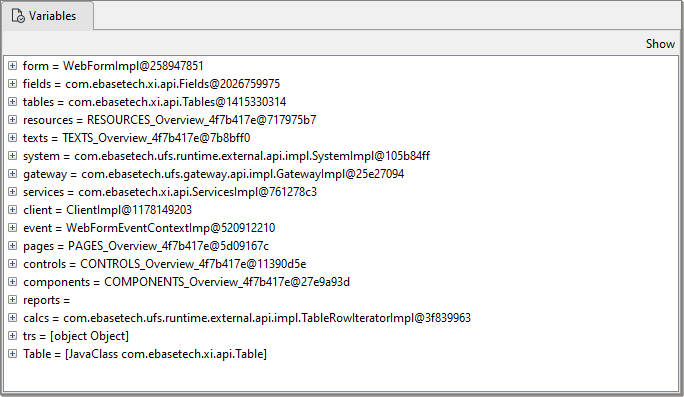
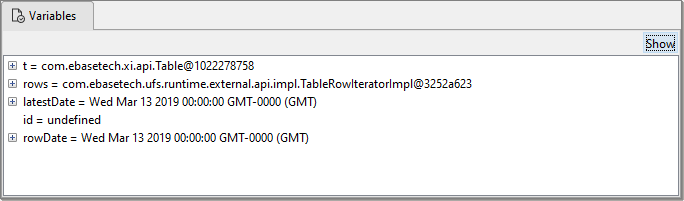
At lower levels you will see just the variables within the current scope.
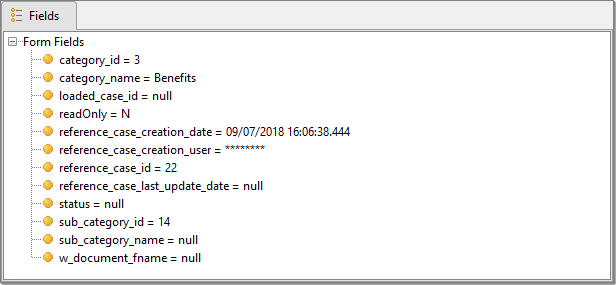
Fields Panel
The fields panel shows the value of all form fields. If the form contains linked components, these are shown separately at the bottom of the panel. Also see Large Text Values.
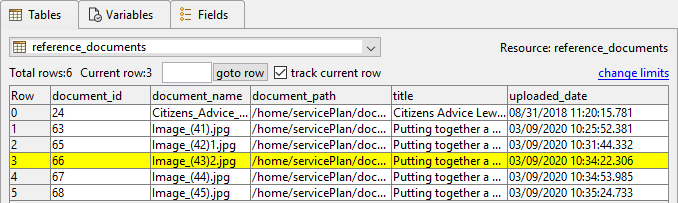
Tables Panel
The tables panel shows the contents of all tables. The current row of the selected table is highlighted in yellow. Initially only 100 rows and 20 columns are shown, but these limits can be overridden by clicking the change limits hyperlink. By default the system will follow the current row of the table as it changes and will scroll the display to keep the current row within view. You can disable this behaviour by unchecking the track current row checkbox. You can also jump to display any selected row by entering its row number and clicking the goto row button. Also see Large Text Values.
Row numbers are maintained internally by the system and don’t form part of the table content. Note that row numbering starts at row 0.
Large Text Values
Variable, field and table cell
values are limited to 100 characters. The ![]() image is displayed next to the text when the
value is truncated. By clicking the
image is displayed next to the text when the
value is truncated. By clicking the ![]() icon at the end of the text will call the
server for the full text value and display this in a popup dialog.
icon at the end of the text will call the
server for the full text value and display this in a popup dialog.
Click the X at the top right hand corner to close the dialog.
Debug View Frame
The Debug View is a dockable frame that can be dragged and anchored in a different location within the studio. It can be hidden if required by clicking the x in the top right-hand corner. It will be shown automatically whenever a debug session is started. It can also be explicitly hidden/shown using the View menu on the studio main toolbar.